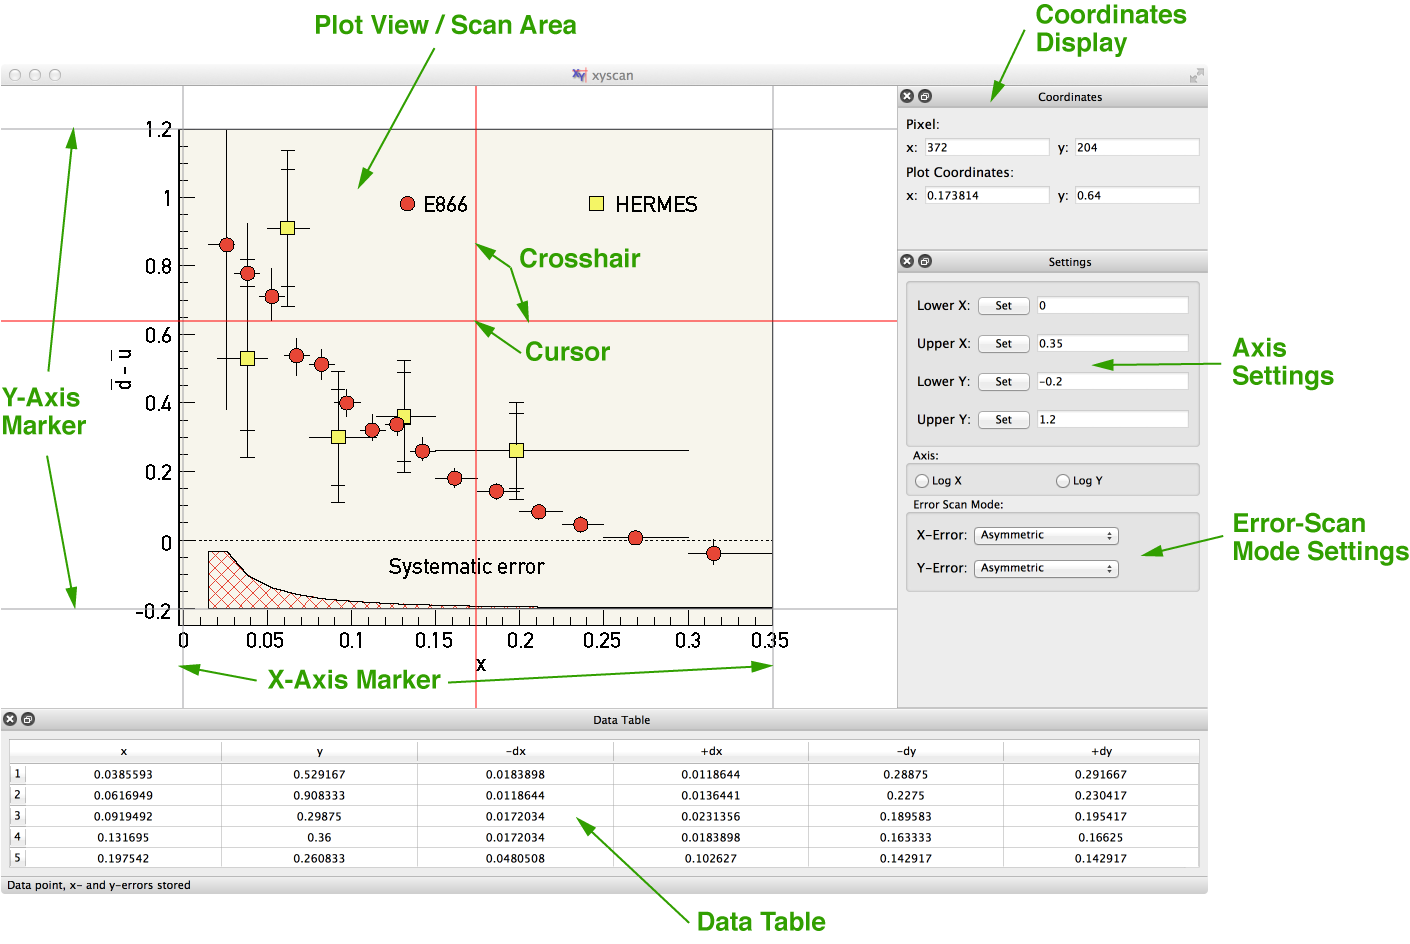
Below is a screenshot of xyscan's main window with all the major windows docked to it. The exact layout will depend on the platform. The green labels point to the main components of xyscan. At startup the scan area is white and all panels except the data table are docked to the main window. Note the four markers (2 on the y and 2 on the x axis) and the two red lines called the crosshair. Their intersection defines the cursor position.

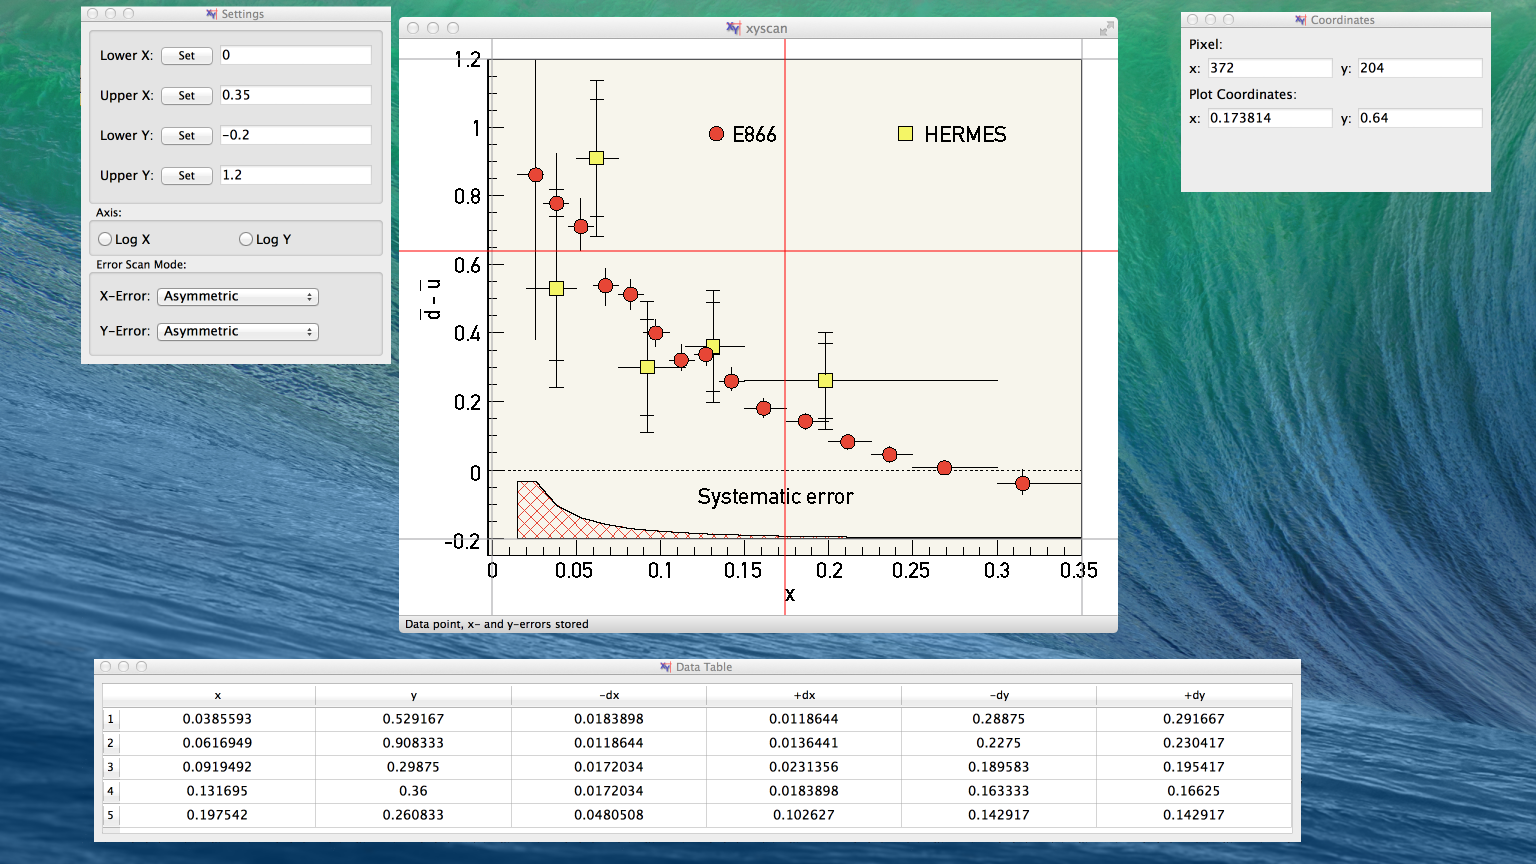
The Coordinate Display, the Data Table, and the Settings Window are so called docking windows. You can detach and re-attach them from the main window at any time. If you close one of the docking windows use View menu in the menu bar to open them again. Below is a view of xyscan with its windows undocked.
