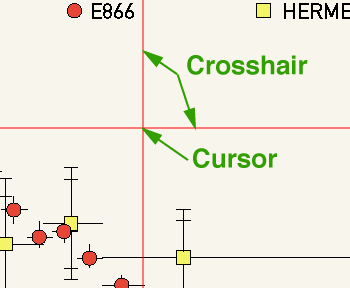
Once the plot is loaded two thin lines become visible (see screenshot below). In the following they are referred to as crosshair. Both lines are exactly one pixel wide. The intersection between the vertical and the horizontal line defines the cursor position. The current x,y coordinates of the cursor are displayed in the Coordinate Display window. Move the cursor (crosshair) using the arrow-up, arrow-down, arrow-left and arrow-down keys. The step size is 1 pixel. If you want to move the cursor faster (in larger increments) press the Shift key together with the arrow key. Alternatively you can also use the mouse. Press the left mouse close to the cursor, i.e., the intersection of the crosshair lines, and drag it while keeping the mouse button pressed. Even quicker is double-clicking the left mouse button to make the crosshair step to the current mouse/pointer position.
Depending on the color
scheme of the plot you are scanning the red default color of the crosshair might be not
the best choice. Pick a color that contrasts well with the color of the data points.
The color can be changed via the Edit->Crosshairs Color... menu item.
Hint: For moving the cursor quickly over the plot the mouse & double-click is certainly faster but use the arrow keys when placing the markers and especially when placing the cursor for the actual scan.