Quickplot Help
Terminology
We need to distinguish between the two terms plot and graph.
In Quickplot a graph displays one or more plots.
Quickplot displays each graph in a page tab, like pages in
a web browser.
Quickplot can load data from: GUIs (graphical user interfaces), files listed
on the command line, and from standard input (pipes) too. Data
is loaded into channels. A channel represents a series of numbers,
like for example the values for one variable, or a column of numbers in
a spreadsheet. Other names for channel may be
dimension, coordinate, degree-of-freedom, field, or component.
We call them all channels in Quickplot.
Any two channels may be plotted against each other
whether they are from the same file or not.
A plot is a graphically representation of two channels, call them the X and Y
channels.
Any number of plots may be made on a graph.
The graph is like the paper we put the plots on.
Zooming
-
Grab Zooming Put the pointer (mouse) in the graph
window. Press the left mouse button and hold
it while dragging the graph by moving the pointer. Release the left
mouse button and the graph will stop moving with the pointer.
-
Zooming In Put the pointer (mouse) on a corner of a
graph region you want to zoom to. Press the right mouse button
and hold and drag the zoom box. Release the
right mouse button then it is at another corner of the zoom
region. Now Quickplot will zoom into that zoom region. You
can zoom in as many times as you like.
While holding the left mouse button
you can press the shift key or the control key while
pulling the zoom box to "shift" or "resize about the center"
respectively.
You can zoom to a view of smaller plots by just pressing and
releasing the right mouse button, without moving the pointer.
Do it again and the plots get even smaller.
You can do this any number of times.
-
Zooming Out Put the pointer (mouse) in the graph
window. Press the right mouse button and hold and drag the zoom
box. Release the right mouse button then it (the zoom box) is
past one edge of the graph window. Now Quickplot will zoom out to
the previous zoom level. Pressing the z key will do the same thing.
Or to zoom out to a full view (top zoom level) of the graph: put
the pointer (mouse) in the graph window. Press the right mouse
button and hold and drag the zoom box. Release the right mouse
button then the zoom box is past two edges (a corner) of the graph
window. Now Quickplot will zoom out to the top zoom level (no
zoom). Pressing Z (shift-z) will do the same thing.
Graph Value Picking
First open the Graph Details window by typing 'g', by using the
View menu, or by clicking the Graph Details button on the button bar.
Then select the "Plots List and Values" tab.
The middle mouse button is used for picking and
displaying X and Y values from the graph. Just try it and see.
There are three modes of number display value picking, which may
be selected on the top of the "Plots List and Values" page (tab):
- Pointer Values shows values where the mouse
pointer is in the scale of the respective plot
- Interpolate Plot Values shows values where the
X position of the mouse pointer is with the Y value displayed being a
linearly interpolated value.
This requires that all plots be functions of one particular channel.
- Pick Plot Point Values shows X and Y plot point
positions that are closest to mouse pointer X position.
This also requires that all plots be functions of one particular channel.
For the "Pointer Values" and "Interpolate Plot Values" modes the
number of significant digits displayed will vary with the value change
per pixel.
So you will not see digits that are not representative of the
mouse position.
Zooming will change the number of significant digits displayed.
Loadable File Formats
Quickplot can read ASCII text and sound files:
ASCII text
Quickplot can load ASCII text (plan
text) files. The number of values on each line need not be the same,
but any missing values will be filled with NAN.
Any number of non-number characters other than a new
line character may used to separate numbers on a given line.
NAN, INF, -NAN, -INF, +NAN, and +INF (lower case too) are numbers that
can be read by quickplot.
Any line starting with zero or more white space characters
and then a any one of ! " # $ % & ' ( ) /
< = > ? @ C c is a comment line that
is ignored.
Any lines with no numbers that can be read will be ignored.
If you wish to have a break in a
plot line put a NAN (stands for not-a-number) in the channel
(column) at the point
(or non-point) where you wish to put the break at.
|
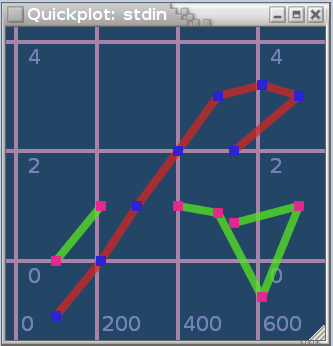
Example:
| 1e2 | 0 | -1 |
| 2.1e2 | 1 | 0 |
| 3e2 | NAN | 1 |
| 4.01e2 | 1 | 2 |
| 5e2 | 0.87 | 3 |
| 6.1e2 | -0.65 | 3.2 |
| 7e2 | 1 | 3 |
| 5.4e2 | 0.7 | 2 |
|
|
|
Graph with two plots: column 1 versus column 0 and column 2 versus column
0.
Note that when Quickplot plots a point with a x or y value of NAN (or INF)
the point is skipped and there is not a connecting line to the
adjacent points.
|
|
|
In Austria it may look like:
| 1e2 | 0 | -1 |
| 2,1e2 | 1 | 0 |
| 3e2 | NAN | 1 |
| 4,01e2 | 1 | 2 |
| 5e2 | 0,87 | 3 |
| 6,1e2 | -0,65 | 3,2 |
| 7e2 | 1 | 3 |
| 5,4e2 | 0,7 | 2 |
|
The above example has three channels and eight samples (set of values) for each
channel. A file may have any counting number of channels, that's
1,2,3,4 or more channels.
With the use of NAN, as a kind of plot line terminator,
you can use Quickplot to draw figures composed of
straight line segments.
Here's a silly example.
Copy and paste the following command to draw this house:

|
echo -e "-10 8 -8 1 -1.5 -6\n-10 -6 -4 1 1.5 -6\n\
10 -6 -4 5 1.5 3\n10 8 -8 5 -1.5 3\nnan nan -8 1 -1.5 -6\n\
-13 8 nan nan\n13 8 4 1\n0 20 8 1\n-13 8 8 5\nnan nan 4 5\n\
nan nan 4 1" | quickplot -P --line-width=2 --no-grid \
--no-border --cairo-draw -C 'rgba(0,0,0,0)' --no-gui \
--no-points --geometry 79x87 -F -g "0 1 2 3 4 5"
|
Using NAN as a line terminator can be very handy when drawing
phase plots when you need to avoid connecting points that
should not be connected and you don't want to make more
channels (degrees of freedom).
For phase space plots the NAN can be thought of as a place
holder where you removed part of the series
because it is not accessible in the current model sampling.
If a file is loaded with a single channel
an additional channel, with the same number of values as the channel in
the file, will be added before the channel from the file.
Quickplot can read
CSV
files.
libsndfile sound file
Using the package libsndfile Quickplot can
read many sound file formats. An incomplete list of readable
sound file formats includes: Ogg/Vorbis,
Microsoft WAV, SGI/Apple AIFF/AIFC, and
Sun/DEC/NeXT AU/SND. See the libsndfile home-page
for a full list of supported sound file formats.
When loading a sound file the first channel (sequence) loaded will be
the time sequence, then each sound channel will follow in separate
channels.
Quickplot may be a little slow with sound files larger than thirty
seconds long. Thirty seconds of sound sampled at 44 kHz
with one channel would load 1.32 million data points.
Command Line Options
Usage: quickplot [OPTIONS]
Graphs will be generated for each file loaded, unless options are
given that tell Quickplot to do otherwise. The default number of
plots in a graph will be up to 12 plots or just the
number channels in the file minus one if that is less, unless options
override that. The default initial plots will be of all channels
except the first channel in the order that the channel was loaded from a
file plotted against the first channel in the file. A time channel
will be the first channel generated for all sound files loaded.
The order of argument options matters.
Options take effect in the order that
they are given with later options overriding
earlier ones.
The options that cause actions like graph "something" must
come after the option that says to read the file that has
"something" in it.
In general, the order of argument options gives
the order in which things happen as Quickplot starts up.
Short options, like -n20,
that require a sub-argument, may not be grouped with other short
options in one argument. For example the argument
-on20, is not valid, but -oN is a valid argument
with two options o (--no-points) and
N (--no-pipe), and -n20
is a valid option (--number-of-plots=20) that
sets the default number of plots to 20.
All of the command line options set things that can
be changed with the Quickplot graphical user interface (GUI).
For example, if you start with a graph with no lines and just points
showing, you can click a GUI to add the lines after the program
starts.
OPTIONS
| long option |
short |
arg |
description |
|
|
|
FILE
|
read data from file FILE. If FILE is - (dash)
then standard input will be read. This is the
same as the
--file
option. See also
--pipe.
|
|
--about
|
-a
|
|
display introductory information about Quickplot in
a browser and exit
|
|
--auto-scale
|
-A
|
|
automatically select the X and Y scales for graphs containing
more than one plot. This is the default. See
also
--same-x-scale,
--same-y-scale,
--same-scale
--different-scale.
|
|
--background-color
|
-C
|
RGBA
|
set the color of the graph background. RGBA may
be any string that GTK+ can parse into a RGB or RGBA
color. For examples
--background-color='rgba(0,0,255,0.5)'
will make translucent blue, and
-C '#050'
will make a dark green.
|
|
--border
|
-b
|
|
add a border to main window. This is the default. See
also
--no-border.
|
|
--buttons
|
|
|
show the button bar in the main window. This is
the default. See also
--no-buttons.
|
|
--cairo-draw
|
-c
|
|
draw graphs using the Cairo API. Cairo drawing
may be slower, but you get translucent colors and anti-aliasing
in all aspects of the graph and in saved image files. See
also
--x11-draw.
|
|
--default-graph
|
-D
|
|
create the default graph for the current file and turn
default graphing for future files read. If you
give a
--graph
or
--graph-file
after this option you will generate an additional graph. A
default graph will be made each time this option is
encountered, so this can be used to control when, in
the sequence of command line options, graphs are made. See
also
--no-default-graph.
|
|
--different-scale
|
-d
|
|
graphs with more than one plot will have different scales
if the extreme values in each plot are not all the same. See
also
--same-scale,
--same-x-scale
and
--same-y-scale.
|
|
--file
|
-f
|
FILE
|
read data from file FILE. If FILE is - (dash)
then standard input will be read. See also
--pipe.
|
|
--fullscreen
|
-F
|
|
make the main window fullscreen. See also
--no-fullscreen
and
--maximize.
|
|
--gaps
|
|
|
interpret NAN, -NAN, INF, -INF, and double overflow
numbers as a gap in the plot, and don't draw a connecting
line to adjacent non-gap points. This is the default. See
also
--no-gaps.
|
|
--geometry
|
|
GEO
|
specify the position and size of the main window. To
set the geometry back to the default just set GEO to
NONE. Example
--geometry=1000x300-0+30
|
|
--graph
|
-g
|
LIST
|
make a graph with plots
LIST. The
LIST
is of the form
"x0 y0 x1 y1 x2 y2 ...". For
example:
--graph "0 1 3 4"
will make two plots in a graph. It will plot channel
1 vs channel 0 and channel 4 vs channel 3 in the same
graph. Data channels are numbered, starting at
0, in the order that they are created as files are read. A
separate graph tab will be created for each
--graph
option given. This
--graph
option must be after the file loading options that load
the channels that it lists to plot. See also
--graph-file.
|
|
--graph-file
|
-G
|
LIST
|
make a graph with plots
LIST. The
LIST
is of the form
"x0 y0 x1 y1 x2 y2 ...". Example:
--graph-file "0 1 3 4"
will make two plots in a graph. It will plot channel
1 vs channel 0 and channel 4 vs channel 3 in the same
graph. A separate graph tab will be created for
each
--graph-file
option given. This is like the
--graph
option except that the channel numbers start at zero
for the last file read. They are relative channel
numbers. So channel numbers for
---graph-file
may be negative to refer to channels that came from
files before the last file. This is handy if you
load a lots of files and lose count of the number of
channels loaded in each file.
|
|
--grid
|
|
|
draw a grid with the graph. This is the default. See
also
--no-grid.
|
|
--grid-font
|
-T
|
FONT
|
set the font used to in the grid label numbers. Example:
--grid-font='Sans Bold 12'. The
default grid font is "Sans 10".
|
|
--grid-line-color
|
|
RGBA
|
set the graph grid lines color. RGBA may be any
string that GTK+ can parse into a RGB or RGBA color. For
example
--grid_line_color='rgba(255,0,0,0.5)'
will make a translucent red.
|
|
--grid-line-width
|
-W
|
PIXELS
|
set the width of the grid lines if there are any
|
|
--grid-numbers
|
|
|
show grid numbers. This is the default. The
grid must be showing to show grid numbers too. See
also
--no-grid-numbers.
|
|
--grid-text-color
|
|
RGBA
|
set the graph grid text color. RGBA may be any
string that GTK+ can parse into a RGB or RGBA color. For
example
--grid_text_color='rgba(0,255,0,0.5)'
will make translucent green.
|
|
--grid-x-space
|
-X
|
PIXELS
|
set the maximum x space between vertical grid lines.
The minimum will be about half this. This distance
varies as the scale changes due to zooming. This
distance cannot be fixed due to the way Quickplot scales
your graphs and always picks reasonable grid line spacing. See
also
--grid-x-space.
|
|
--grid-y-space
|
-Y
|
PIXELS
|
set the maximum y space between horizontal grid lines. See
also
--grid-x-space
above.
|
|
--gtk-version
|
|
|
print the version of GTK+ that Quickplot was built with
and then exit
|
|
--gui
|
|
|
show the menu bar, button bar, tabs bar, and the status
bar. This is the default. See also
--no-gui.
|
|
--help
|
-h
|
|
display help in a browser and exit
|
|
--label-separator
|
-p
|
STR
|
specifies the label separator string STR if labels are
read in from the top of a text data plot file. The
default value of
STR
is
" "
(a single space). See option:
--labels.
|
|
--labels
|
-L
|
|
read labels from the first line of a text file that
is not skipped. See also:
--skip-lines,
--label-separator
and
--no-labels.
|
|
--libsndfile-version
|
|
|
print the version of libsndfile that Quickplot was built
with and then exit
|
|
--line-width
|
-I
|
PIXELS
|
specify the plot line widths in pixels. May be
set to AUTO to let Quickplot select the line width based
on the plot point density. AUTO is the default.
|
|
--linear-channel
|
-l
|
[OPTS]
|
OPTS
are
START|[STEP]. This
option prepends a linear series channel to the file
being read.
-
START set the first
value in the sequence to
START. The default
START
value is
0.
-
STEP set the sequence
step size to
STEP. The default
STEP
is 1.
There must be a
START
before
STEP. For example:
--linear-channel='100 0.2'
will make a linear channel that starts at 100 and steps
0.2. Sound files will always have a linear channel
that contains the time prepended. Using this option
with a sound file would prepend an additional channel. Any
file loaded that contains just a single channel will
automatically have a channel prepended. Using
this option with a single channel file will not prepend
an additional channel, but will let you set the start
and step values for that prepended channel. See
also
--no-linear-channel.
|
|
--lines
|
-j
|
Y|N|A
|
-
Y yes show lines.
-
N no don't show
lines. Same as
--no-lines.
-
A auto, be smart
about it. This is the default.
|
|
--local-menubars
|
|
|
disable that darn Ubuntu Unity globel menu bar. This
will do nothing if not running with Unity.
|
|
--maximize
|
-m
|
|
maximize the main window. See also
--no-maximize
and
--fullscreen.
|
|
--menubar
|
|
|
show the menu bar. This is the default. See
also
--no-menubar. This
will do nothing if not running with the Ubuntu Unity
window manager.
|
|
--new-window
|
-w
|
|
make a new main window for each graph
|
|
--no-border
|
-B
|
|
display graphs main windows with no borders
|
|
--no-buttons
|
|
|
hide the button bar in the main window. See also
--buttons.
|
|
--no-default-graph
|
-U
|
|
stop making the default graph for each file loaded. See
also
--default-graph.
|
|
--no-fullscreen
|
|
|
don't make the main window fullscreen. This is
the default. See also
--fullscreen.
|
|
--no-gaps
|
-J
|
|
draw a line across NAN (-NAN, INF, -INF and overflow
double) values if there are finite values on both sides. See
also
--gaps.
|
|
--no-grid
|
-H
|
|
don't draw graph grid lines in the graph. See
also
--grid.
|
|
--no-grid-numbers
|
|
|
don't show grid numbers. See also
--grid-numbers.
|
|
--no-gui
|
-z
|
|
don't show the menu bar, button bar, tabs bar, and status
bar. See also
--gui.
|
|
--no-labels
|
-Q
|
|
don't read channel labels from the file. This
is the default. See also
--labels.
|
|
--no-linear-channel
|
-k
|
|
turn off adding a linear channel for up coming files. See
also
--linear-channel.
|
|
--no-lines
|
-i
|
|
plot without drawing lines in the graph. See also
--lines.
|
|
--no-maximize
|
|
|
don't maximize the main window. This is the default. See
also
--maximize.
|
|
--no-menubar
|
-M
|
|
don't display the menu bar in the main window. See
also
--menubar. This
will do nothing if not running with the Ubuntu Unity
window manager.
|
|
--no-new-window
|
-Z
|
|
don't make a new main window for the graph. This
is the default. See also
--new-window.
|
|
--no-pipe
|
-N
|
|
don't read data in from standard input even if there
is input to read. See also
--pipe.
|
|
--no-points
|
-o
|
|
plot without drawing points in the graph. See
also --points.
|
|
--no-readline
|
|
|
don't use GNU readline with the Quickplot command shell
if you run with the
--shell
option. This will disable the use of line editing,
shell history, and tab command completion. This
option has no effect if Quickplot is not built with
GNU readline.
|
|
--no-shape
|
|
|
turn off the use of the X11 shape extension. See
also
--shape.
|
|
--no-statusbar
|
|
|
hide the status bar in the main window. See also
--statusbar.
|
|
--no-tabs
|
|
|
don't show the graph tabs in the main window. See
also
--tabs.
|
|
--number-of-plots
|
-n
|
NUM
|
set the default maximum number of plots for each graph
to NUM
|
|
--pipe
|
-P
|
|
read graph data from standard input. By default
Quickplot looks for data from standard input and stops
looking if no data is found in some short amount of
time. This option will cause Quickplot to wait
for standard input indefinitely. If you would
like to type data in from the terminal use
--pipe. This option
is the same as
--file=-.
|
|
--point-size
|
-O
|
PIXELS
|
start Quickplot using plot point size
PIXELS
wide in pixels. This may be set to
AUTO
to have quickplot automatically set the point size depending
on the point density that is in graph.
AUTO
is the default.
|
|
--points
|
|
|
show points in the plots in the graph. This is
the default.
|
|
--print-about
|
|
|
prints the About document to standard output andthen
exits. Use option
--about
to display an HTML version of the Quickplot About information.
|
|
--print-help
|
|
|
prints this Help document as ASCII text to standard
output and then exits. Use option
--help
for displaying an HTML version of this help.
|
|
--read-pipe-here
|
-R
|
|
this is a place holder that tells Quickplot when to
read the data from standard input. This is intended
to give the option of telling Quickplot when to read
standard input when Quickplot automatically determines
whether to read standard input or not. See options
--file,
--pipe
and
--no-pipe.
|
|
--same-scale
|
-s
|
|
plot all plots in the same graph scale. See also
--different-scale,
--same-x-scale
and
--same-y-scale.
|
|
--same-x-scale
|
-x
|
Y|N|A
|
use in place of
--same-scale
or
--auto-scale
for finer control over how the x values of the plots
are scaled when you have more than one plot on a graph
-
Y yes same x scale
-
N no different x
scales
-
A auto, be smart
about it. This is the default.
See also
--same-y-scale.
|
|
--same-y-scale
|
-y
|
Y|N|A
|
use in place of
--same-scale
or
--auto-scale
for finer control over how the x values of the plots
are scaled when you have more than one plot on a graph
-
Y yes same y scale
-
N no different y
scales
-
A auto, be smart
about it. This is the default.
See also
--same-x-scale.
|
|
--shape
|
|
|
make graphs see through. It uses the X11 shape
extension which was made famous by xeyes. The
X11 shape extension may be a little flashy on some systems. Try
using
--shape
with the
--no-gui,
--no-grid,
and
--no-border
options to make a floating graph on your display. The
use of the X11 shape extension is a property of the
main window, not each graph tab. This option may
not work well with fullscreen view. This will
slow down graph drawing considerably. You can
toggle this on and off with the
x
key. See option
--no-shape.
|
|
--shell
|
-e
|
|
run a Quickplot command shell that reads commands from
standard input and writes out to standard output. The
default is no shell and standard input will be read
as graph data. If Quickplot is reading standard
input for plot data Quickplot will read shell commands
from the controlling terminal (/dev/tty) after all the
standard input has been read. You may use
--no-pipe
to stop standard input from being read as graph data. The
shell can do most all the things that command-line options
can do and a lot more. Run an interactive shell
with
quickplot --shell
and use the help and tab completion to see how it works. You
can also connect a Quickplot command shell to a running
Quickplot program with the program
quickplot_shell.
|
|
--signal
|
|
PID
|
signal SIGUSR1 to process PID after Quickplot is running.
|
|
--silent
|
|
|
don't spew even on error. The
--silent
option will override the effect of the
--verbose
option.
|
|
--skip-lines
|
-S
|
NUM
|
skip the first
NUM
lines when reading the file. This applies of all
types of files that quickplot can read. Set
NUM
to zero to stop skipping lines.
|
|
--statusbar
|
|
|
show the status bar below the graph. This is the
default. See also
--no-statusbar.
|
|
--tabs
|
|
|
show the graph tabs. This is the default. See
also
--no-tabs.
|
|
--verbose
|
-v
|
|
spew more to standard output. See also
--silent.
|
|
--version
|
-V
|
|
print the Quickplot version number and then exit returning
0 exit status
|
|
--x11-draw
|
-q
|
|
draw points and lines using the X11 API. This
is the default. Drawing may be much faster than
with Cairo, but there will be no translucent colors
and no anti-aliasing in the drawing of the plot lines
and points. There will be translucent colors and anti-aliasing
in the background and grid. Also, saved images
will not have translucent colors like they do with the
Cairo draw mode. You can start drawing with X11
and switch to drawing with Cairo when you want to save
an image. Use the
r
key or the View menu to switch back and forth between
drawing with X11 and Cairo. See also
--cairo-draw.
|
For example the command
quickplot file0.txt file1.wav file2.csv file3.dat
will make four graphs in four tabs in one main window.
The command
quickplot file0.txt file1.wav file2.csv --new-window file3.dat --no-new-window
will make two windows with two graphs in each window. You see: file1.wav will be
forced to be graphed when the parser hits the argument file2.csv, and
file2.csv will be forced to be graphed when the parser hits the
file3.dat argument, at which time the --new-window
is in effect which causes a new window to be used for file2.csv.
file3.dat will be graphed in the same window as file2.csv because the
--new-window option is not longer in effect
when file3.dat is forced to be graphed at the end of the command line.
The command
quickplot load1.txt --no-grid --no-lines load2.txt --lines=y --line-width=9 -F
will make a graph from data in file load1.txt with no connecting lines
and no grid. It will make a graph from the data in load2.txt
with lines with width 9 pixels and no grid.
The main window displayed will not be full screen since the
-F option was given after the main window
would have been created.
The two graphs will be in two different tab pages in the one main window.
The command
quickplot --fullscreen --no-gui load1.txt --default-graph --gui --no-buttons --no-fullscreen --geometry=400x400-0+0 --new-window --graph "0 1" --geometry=400x400+0-0 load2.txt --background-color='rgba(140,140,200,0.6)' --cairo-draw
will make main window with a graph in full screen without GUIs, another smaller main window
with the same plot in the top right corner with GUIs except for the buttons bar,
and another small main window in the bottom left corner with a default graph of
the file load2.txt drawn with Cairo with a translucent blueish
gray background.
The main windows are made when they have to be, which at the
--default-graph, --graph "0 1", and
at the end of the command line when for the default graph of the file
load2.txt must be displayed.
Notice all the graphs are made in a new main window.
That's because the --new-window flag
was set and is not unset as it could be with the --no-new-window
command.
The command
echo -e "graph zoom 2 1 -.5 0\ninput `tty`\n" | quickplot /usr/share/tuxpaint/sounds/areyousure.wav --shell --no-gui --no-pipe
will graph the tuxpaint areyousure.wav file with
the view zoomed to the right half of the graph.
If you ran this from a bash (or tcsh) shell with a tty,
Quickplot program will connect a Quickplot shell
to the tty and give you an interactive Quickplot
shell after running the input tty
command. The --no-pipe
option keeps Quickplot from reading the standard
input as graph data so that it can be read by the Quickplot
shell.
The Quickplot shell will be started after all the command
line arguments are applied, so the shell command
graph zoom 2 1 -.5 0 is applied
to the graph that is showing after the all the
command line arguments are processed.
Type help at the Quickplot shell
prompt.
If you would like Quickplot
to save your Quickplot shell history between sessions
just create a .quickplot_history
in your home directory with a command like
`touch ~/.quickplot_history'.
GTK+ OPTIONS
The following GTK+ options are parsed by
the GTK+ APIs (application
programming interfaces), which Quickplot uses:
| --class=CLASS | Program class as used by the window manager |
| --display=DISPLAY | X display to use |
| --g-fatal-warnings | Make all warnings fatal |
| --gdk-debug=FLAGS | Gdk debugging flags to set |
| --gdk-no-debug=FLAGS | Gdk debugging flags to unset |
| --gtk-debug=FLAGS | Gtk+ debugging flags to set |
| --gtk-module=MODULE | Load an additional Gtk module |
| --gtk-no-debug=FLAGS | Gtk+ debugging flags to unset |
| --gxid-host=HOST | |
| --gxid-port=PORT | |
| --name=NAME | Program name as used by the window manager |
| --screen=SCREEN | X screen to use |
| --sync | Make X calls synchronous |
Keyboard Short-cuts
Quickplot has GUIs for all of the following immutable keyboard short-cuts:
| a | show information about Quickplot using a web browser
|
| b | show/hide the button bar
|
| c | copies the current focused main window so long as
it is not maximized or in fullscreen
|
| d | delete the main window. This will not close the last main window.
|
| e | toggles the visibility of the main window border
|
| f | toggles full screen viewing
|
| g | show/hide the graph detail widget
|
| h | show help using a web browser
|
| i | save a PNG image of the graph
|
| m | show/hide the menu bar or do nothing if there is a globel menu bar
|
| n | make a new graph
|
| o | open a data file
|
| q | quit
|
| r | toggles the between drawing with Cairo and X11
|
| s | show/hide of the status bar
|
| t | show/hide of the graph tabs
|
| u | show/hide of all GUIs |
| w | makes a new main window
|
| x | toggles the X11 shape extension on and off
|
| z | zoom out one level
|
| Z | Zoom out all the way
|
| esc | close the current focused
window. This will not close the last main window.
If the current focused window is in full screen this will change
it to non-full screen.
|
| left/right arrow |
the right and left arrow keys cycle though graph tabs when the buttons
and tabs are not showing
|
|
|
|
Top |
About |
Help
|
|
Quickplot Version 0.10.6
|